Search

Understanding New In-Situ Optical Monitoring Technology – What is it and is it Right for Your Facility?

Read about recent advancements, particularly demonstrated by EPRI on gas turbine combined cycle and coal stacks, that have sparked a growing interest in the integration of in-situ optical monitors in a CEM framework.
Facebook
Twitter
LinkedIn
Understanding New In-Situ Optical Monitoring Technology – What is it and is it Right for Your Facility

For the last three decades, Continuous Emission Monitoring Systems (CEMS) have typically followed an extractive sampling approach. This method involves a sample probe with filtration, a heated umbilical sample transport line, and flue gas conditioning for moisture removal, if not a dilutive-extractive system, along a sample pump.


However, recent advancements, particularly demonstrated by EPRI on gas turbine combined cycle and coal stacks, have sparked a growing interest in the integration of in-situ optical monitors in a CEM framework. One of the key drivers in generating this interest stems from the significant CEMS operation and maintenance savings associated with adopting an in-situ optical monitoring approach. These monitors, devoid of moving parts or heated sample transport lines, typically demand less service labor, consume less power, require lower volumes of calibration gas, and involve fewer spare parts for inventory management.


What is Optical Monitoring Technology?

Optical monitors operate by measuring changes in beam intensity at a specific wavelength, where the absorbance by a targeted specie is proportional to its concentration in accordance to the Beer-Lambert Law:

  • A = log10 (Io/It) = e*l*c
    • A = specie specific absorbance
    • Io = incident intensity
    • It = transmitted intensity
    • e = specie specific molar absorptivity
    • l = measurement path length
    • c = concentration


In this equation, absorbance is measured by comparing the ‘incident light intensity/ to the ‘transmitted light intensity’, as shown below.

Schematic of Optical Monitor Measurement Approach
Figure 1 - Schematic of Optical Monitor Measurement Approach

Individual species exhibit absorbance ‘fingerprints’ within the ultraviolet and infrared spectrum that enable specific measurements to be made at targeted wavelengths without interference.

Figure 2 - Examples of Individual Specie Absorption Patterns Within the Infrared Spectrum

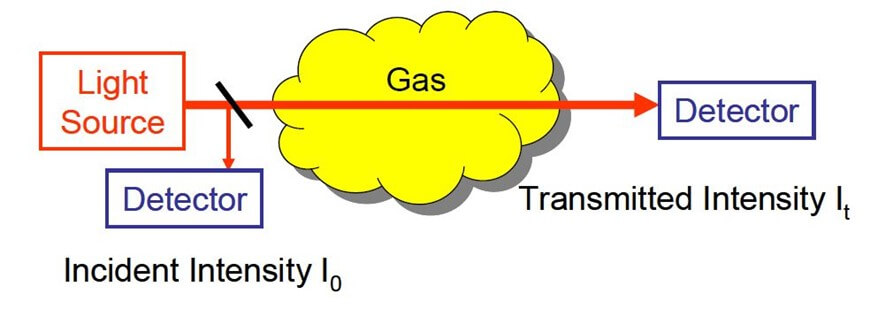
Despite its conceptual simplicity, optical monitors are sophisticated, requiring meticulous selection of specie wavelengths based on measured concentrations, application temperature, and the presence of other species. EPRI projects have successfully demonstrated the measurement of combustion-related species in the stacks of coal- and gas-fired utility sites, including:

  • UV-DOAS Monitor
    • NO
    • NO2
    • NH3
    • SO2
  • Near Infrared Laser Monitors
    • O2
    • CO
    • CO2
    • HCl
    • NH3
    • H2O

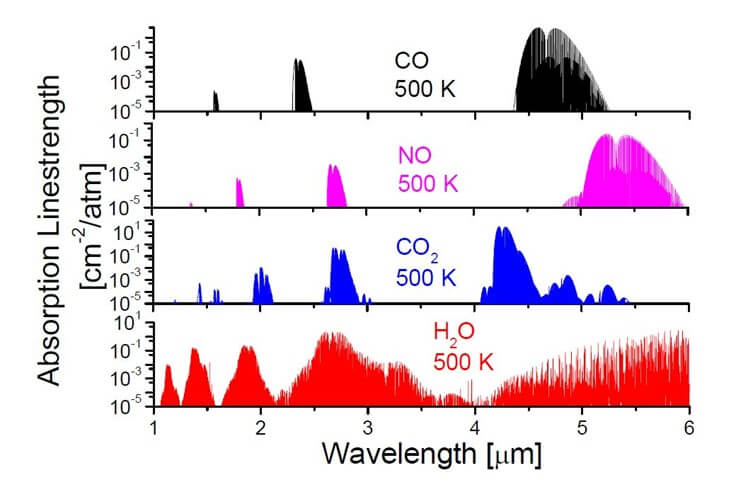
Several factors can influence the ability to measure a target specie at a given site, such as the measurement path length, dust loading, flue gas temperature, as well as the concentration of potential interferent species, such as moisture.

How Does One Calibrate an In-Situ Optical Monitor?

In the case of extractive monitors, the reference gas concentrations follow directly from the monitor span and the percentage of span level to be tested. Extractive monitors employ the same measurement cell for both the sample gas and calibration gas, establishing a one-to-one equivalency between the calibration gas concentration and the measurement range.


Calibration Methodologies for Extractive Monitors and IP-CEMS: A Comparative Analysis

However, the calibration process for IP-CEMS, which incorporates a calibration cell in the optical path with a typically different path length and temperature than the actual measurement path, presents unique challenges. In these instances, the current regulatory framework requires a ppm-meter, or %-meter, equivalency between the calibration cell path and measurement path.


This calibration approach emphasizes comparable absorption based on the measurement of the same number of ‘molecules’ as opposed to the same concentration. For example, 1 ppm within a measurement path length of 10 meters (i.e., 10 ppm-meters) is the same as 100 ppm within a calibration cell of 0.10 meters (i.e., 10 ppm-meters).


Advancing Optical Monitor Calibration Techniques

While this methodology may pose challenges, particularly when the calibration cell is significantly shorter than the measurement path, EPRI’s research is focused on a laboratory assessment of optical monitor linearity over typical ppm-meter and %-meter concentration ranges. Where optical measurements are shown to be linear over the entire measurement range, a potential opportunity exists to calibrate at reduced ppm-meter, or %-meter, concentrations.


In addition, EPRI has been working with optical monitor vendors to identify alternate approaches to the ‘in-line’ calibration process that mitigate issues identified to date. Alternate approaches being evaluated include multi-path calibration cells as well as pseudo in-situ optical measurement systems that could be calibrated in a fashion similar to current extractive monitors.


How Accurate are In-Situ Optical Monitors?

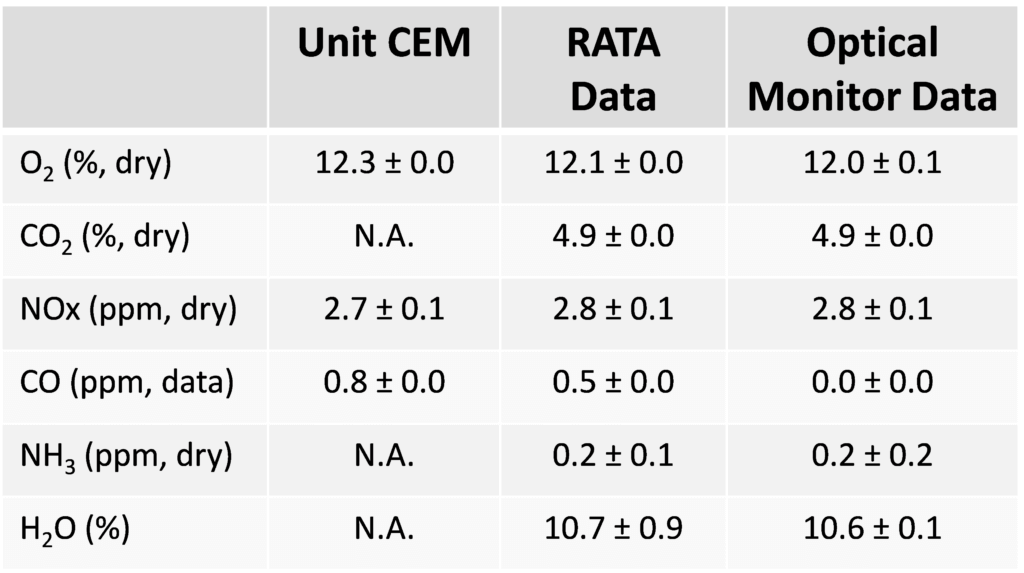
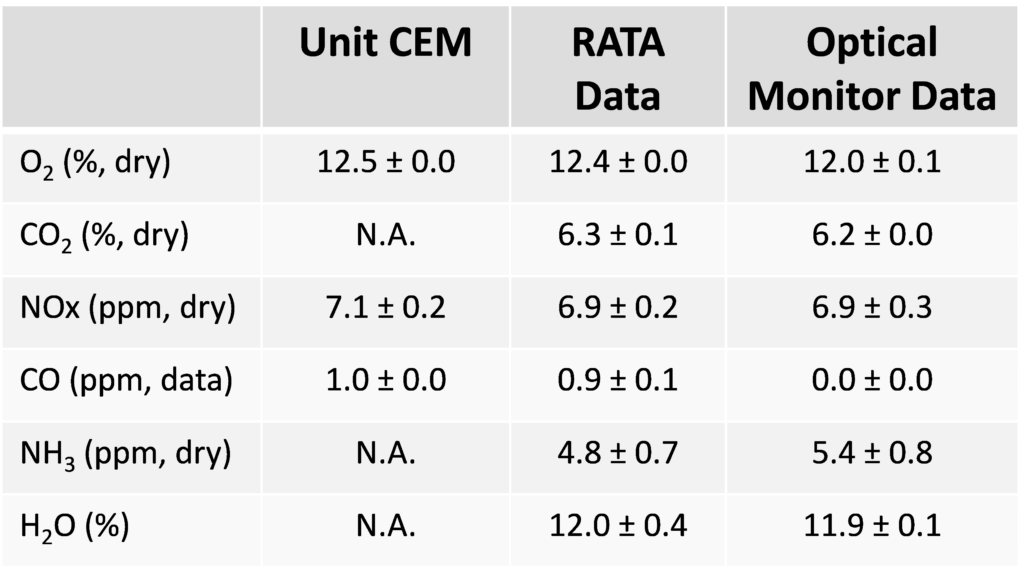
One recent EPRI demonstration project on a dual fuel gas turbine combined cycle (GTCC) unit involved a relative accuracy test audit with unit operation with natural gas and then fuel oil. A summary of the results is shown below, with a more detailed description of the project provided in a presentation made at the EPRI CEM User Group Conference (Himes, 2022). As shown below in Table 1 and Table 2, all results compared favorably to reference method measurements and were within 2% of full scale or 1 ppm of the reference method.

Table 1 – Stack GTCC In-Situ Optical Monitor Results in Comparison to RATA and CEM Data with Natural Gas Firing
Table 2 – Stack GTCC In-Situ Optical Monitor Results in Comparison to RATA and CEM Data with Fuel Oil Firing

For more information on projects that EPRI is spearheading in support of the use of in-situ optical monitors in a CEM capacity, please contact Rick Himes at rhimes@epri.com (714.655.6317).

Picture of Richard Himes, P.E. - EPRI Technical Executive

Richard Himes, P.E. - EPRI Technical Executive

Rick Himes is a Technical Executive at EPRI, where he has worked for the previous 25 years. Rick is working as the Program Leader of Continuous Emissions Monitoring and Measurements and managing projects within other Environmental Controls program areas. Before joining EPRI, Mr. Himes worked as a consultant for 17 years in the electric utility industry, solving combustion-related problems and demonstrating and evaluating emerging emission control technologies. Mr. Himes received a M.S. degree in Mechanical Engineering from the University of California, Irvine, and a M.B.A. from the University of Southern California. Mr. Himes is a Registered Professional Engineer in the State of California.

The Electric Power Research Institute (EPRI) will host its meeting of the Continuous Emissions Monitoring User Group on May 21 – May 22, 2024, in Scottsdale, Arizona. This is a collaborative forum for the electric utility industry to address CEM-related issues. Join our ESC Spectrum team at EPRI at booth 2.


Discover Upcoming Events

Upcoming Events at ESC Spectrum
Skip to content